9C9T Atlas user manual
The 9C-9T Basin Atlas User Manual provides an orientation of the platform for users and guidance on how to access spatial data to inform joint sub-basin planning, management and investment in building resilience to flood and drought
Contents
2.2. Displaying spatial layers
4. Nature-base Solution catalogue
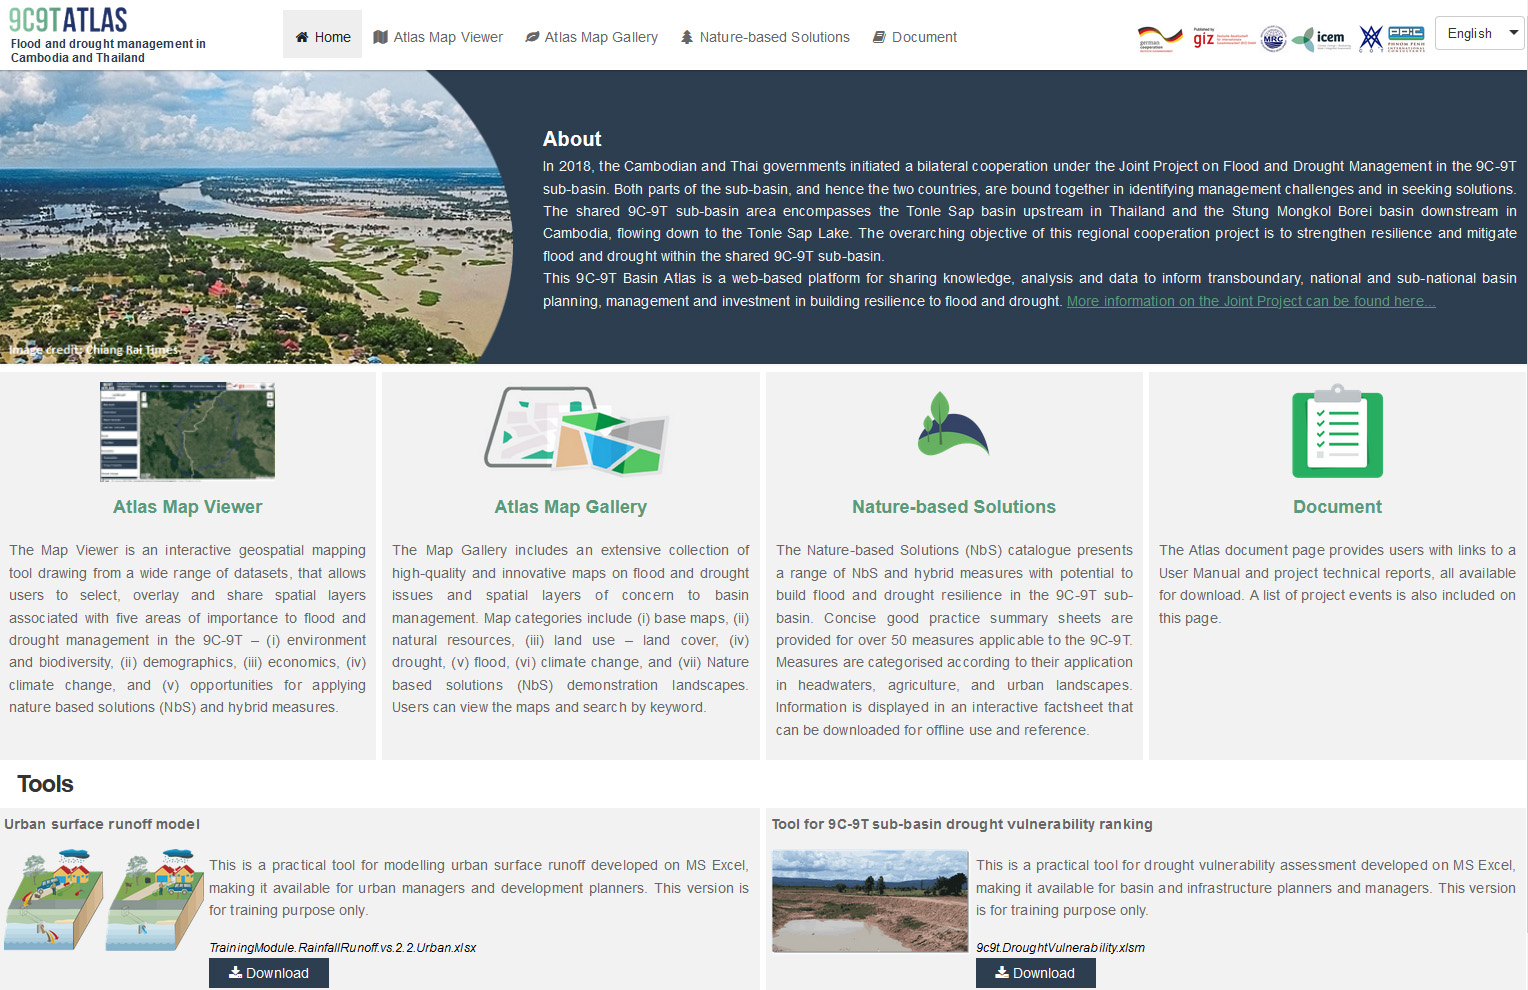
1. Home page
Users accessing the Atlas will first be taken to the Home page where they can explore the site interface. At the top of the page are four tabs, along with the Home tab, that provides navigation to each of the four pages of the site including the Atlas Map Viewer, Map Gallery,Nature-based Solutions and Document. An overview of these pages is presented on the Home page. Users can access the pages by either clicking on the tabs at the top or on the page overview icons.
At the bottom of the Home page, users can also access two different tools for flood and drought modelling (in Excel format). By clicking on the Download button, users can save and work with these tools offline.
Figure 1: Atlas Home page
2. Atlas Map Viewer
The Atlas Map Viewer is an interactive geospatial mapping tool comprising a wide range of datasets, that allows users to select and view spatial layers associated with five key areas of importance to flood and drought management in the 9C-9T. Spatial layer categories include: Environment; Social; Economics; Climate Change; and Resilience Building Opportunities.
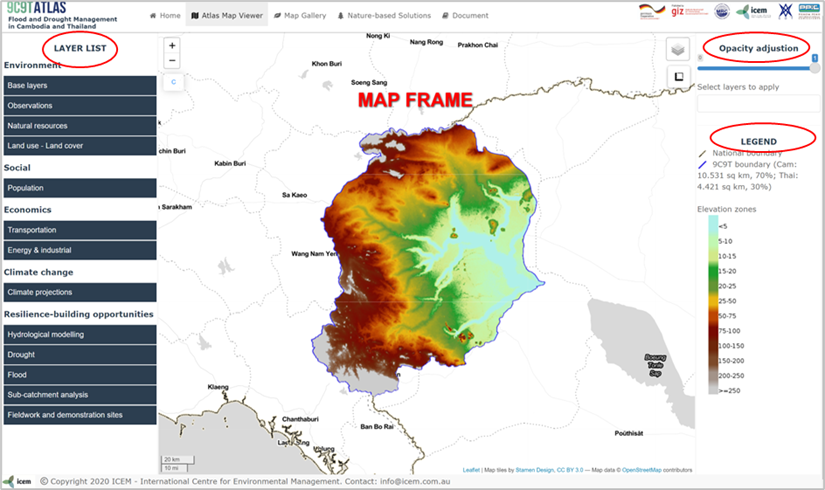
The Atlas Map Viewer provides interactive functionality where spatial data layers can be comprehensively presented and explored. The main components of the viewer, as shown in Figure 2, include:
- Layer List on the right of the page, listing the data layers including in the atlas;
- Map Frame in the middle of the page, for displaying spatial layers;
- Opacity Adjustion tool on the top right of the page, for adjusting the transparency of spatial layers displayed on the Map frame; and
- Legend area under the Opacity Adjustion tool.
Figure 2: The Atlas Map Viewer
2.1. Layer List functionality
On the Layer List, data layers are divided into five groups: Environment, Social, Economics, Climate Change, andResilience Building Opportunities. Each group is further divided into sub-groups consisting of data layers representing similar themes. A list of datasets incorporated into the atlas is attached at the end of this manual for download.
On the Layer List, users are able to:
- Expand or collapse the layer list in each sub-group by clicking on a sub-group name (sub-group name will turn to green when users move the mouse over the name).
- Active or inactive layer on the map frame by checking the box on the left of the layer name:
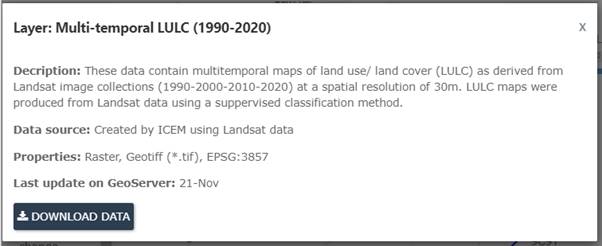
- View layer description and downloadspatial data by clicking on the
 button to the right of a layer name. A pop-up window will appear to display the metadata of the dataset. Metadata information includes layer title, description, data source, data type, coordinate reference system (CRS), and date of the last update. Users can also click on the
  button to download spatial data (in shapefile or GeoTiff formats) for further analysis and working offline on GIS software.
![]() = layer active
= layer active
![]() = layer inactive
= layer inactive
Figure 3: Layer list functionality
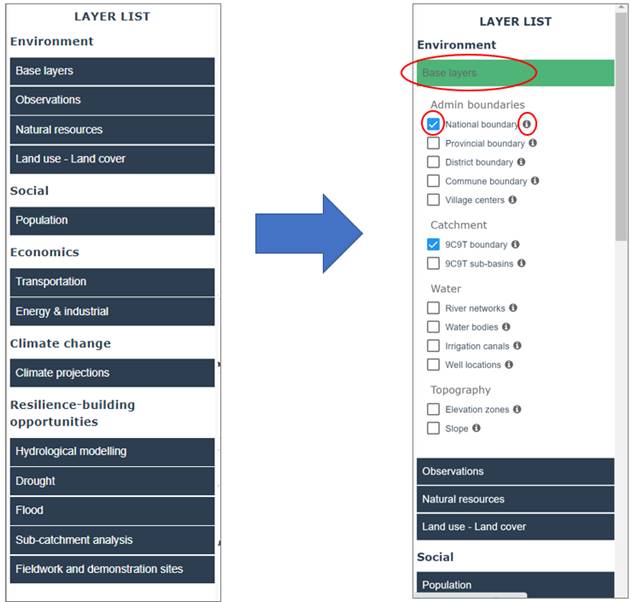
Figure 4: View layer description and download spatial data
2.2. Displaying spatial layers
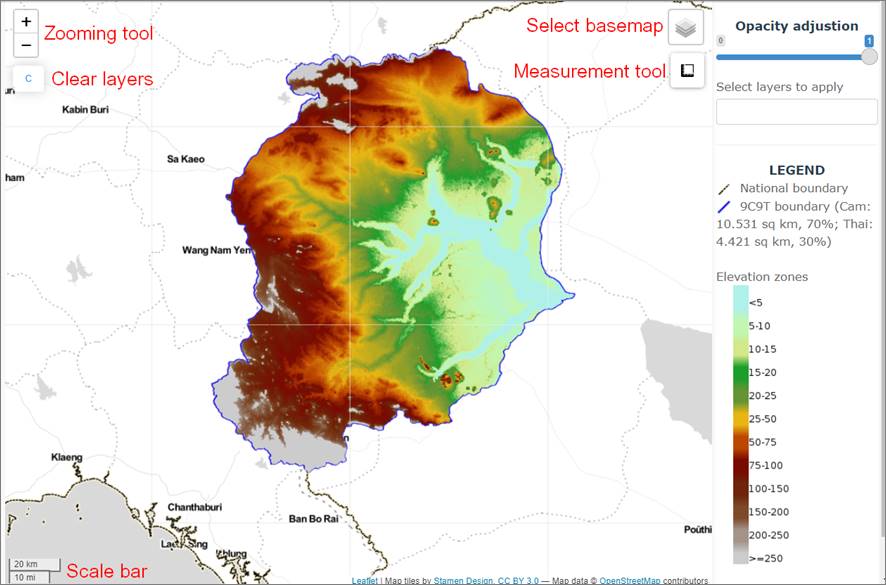
When a layer from the Layer List is active, it will be displayed as an image on the map frame and the layer legend will be displayed on the legend area (to the right of the map frame ? Figure 5). Upon accessing the Atlas Map Viewer, the map will display the 9C-9T sub-basin boundary and the national boundaries of Thailand and Cambodia, overlain on a third-party Stamen TonerLite background map, which is based on OpenStreetMap. Alternatively, other basemap layers are available including Google Map, OpenStreetMap, Google Imagery, Esri World Imagery or Stamen Terrain. These can be selected from the icon ![]() (on the top right of the map frame) to change the background map display. Another functionality accessible from the top of the map frame is a measuring tool
(on the top right of the map frame) to change the background map display. Another functionality accessible from the top of the map frame is a measuring tool ![]() that allows users to calculate distance and area on the map.
that allows users to calculate distance and area on the map.
Figure 5: Functionality on Map frame
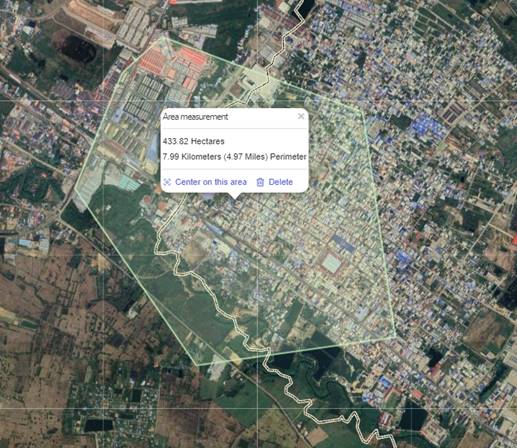
To create a measurement, users can click on the map to start drawing a line or polygon then double click to finish the drawing. A small pop-up will appear to display the measurement results (Figure 6).
Figure 6: Example of area measurement
On the top-left of the map frame, ![]() and
and ![]() icons can be used for zooming in and out, respectively. Alternatively, users can adjust the map scale by scrolling the mouse. Bellow the zooming tool is a ?C? button to clear all maps from the display (excepting the national and sub-basin boundaries).
icons can be used for zooming in and out, respectively. Alternatively, users can adjust the map scale by scrolling the mouse. Bellow the zooming tool is a ?C? button to clear all maps from the display (excepting the national and sub-basin boundaries).
The map scale is illustrated by a scale bar displayed on the bottom left of the map frame (Figure 5).
Opacity adjustion
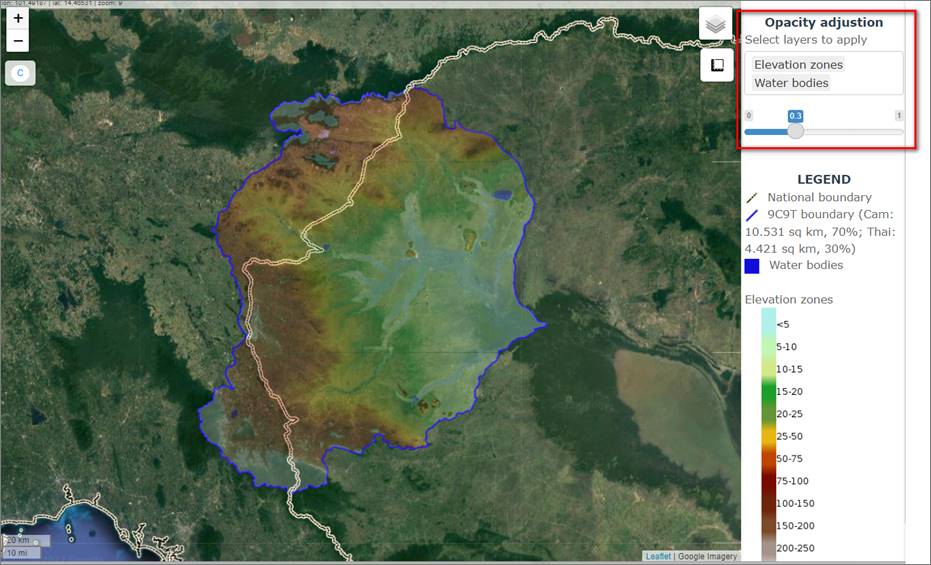
The Opacity adjustion tool is designed to modify the transparency of spatial layers displayed on the map. To adjust the opacity level (from 0 to 1), users first need to select relevant layers to be applied (these can be single or multiple layers) and then change the transparency using the slider. Figure 7 below shows an example of reducing opacity level of the Elevation zones and Water bodies layers from 1 to 0.3 to better see the Google Imagery background map.
Figure 7: Example of using Opacity Adjustion tool
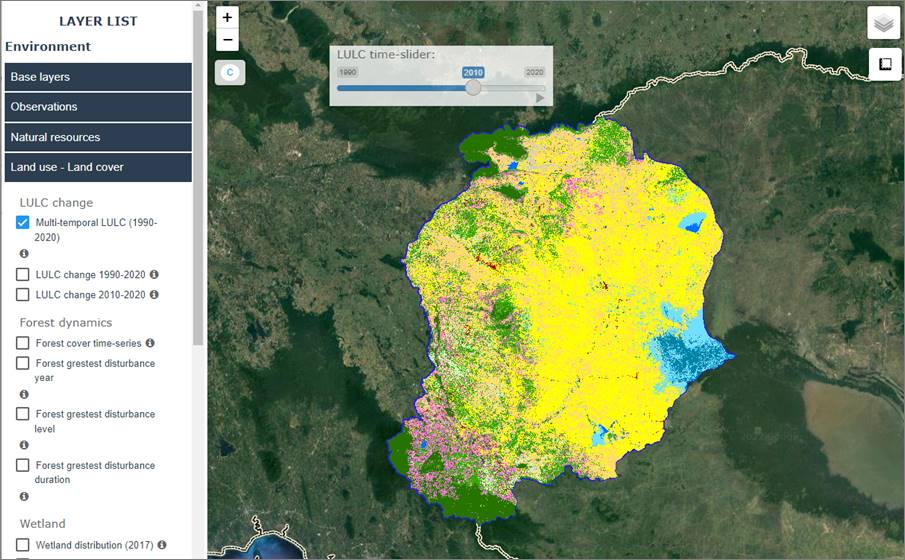
Multiple data layers
Some datasets incorporated into the Atlas comprise multiple data layers (such as Soil Bulk Density by different depth levels) or time-series layers (such as Land cover dataset). When these layers are selected from the Layer List, a Slider will appear on the map frame that allows users to change the layer they want to display on the map (e.g., by time or by depth) (Figure 8). Note that the slider?s position on the map frame is relative, so users can move it to another position.
Figure 8: Displaying multi-temporal land cover dataset with the time-slider on the map frame
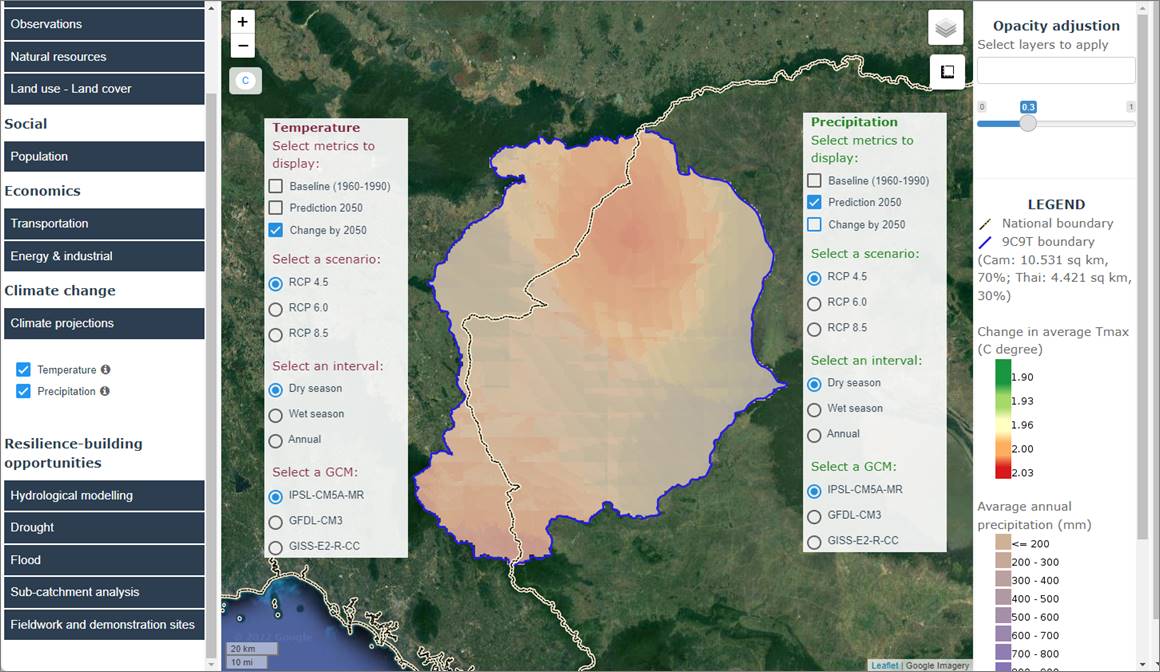
Climate projections
Climate projection datasets include temperature and precipitation. When they are selected from the Layer List, pop-ups will appear on the map frame to ask users to define which data layers they want to explore. Thiss can be done by selecting different parameters including time metric, projection scenario, season, and GCM (Figure 9).
Figure 9: Displaying climate projections
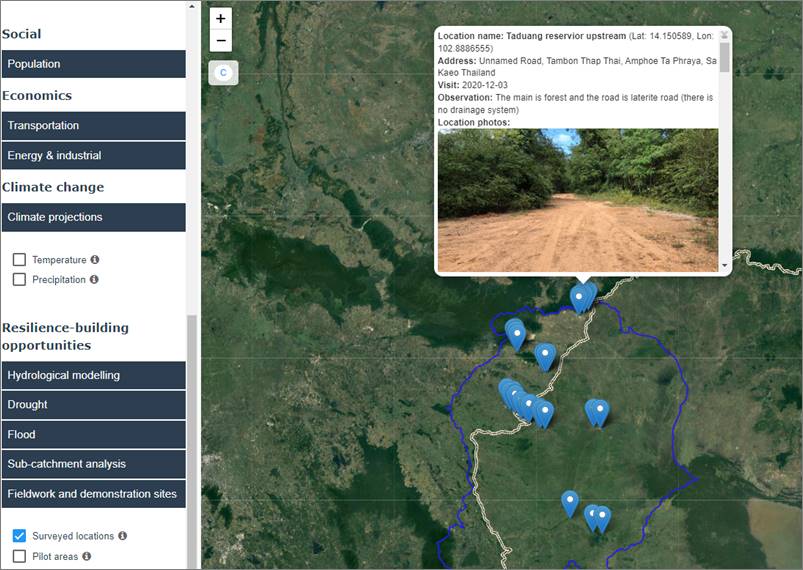
Fieldwork and demonstration sites
This sub-group layer represents prospective NbS demonstration landscapes and specific field survey locations. Users can click on a survey location to see a short presentation (including photos and descriptions) of the main findings (Figure 10).
Figure 10: Seeing description of a surveyed location
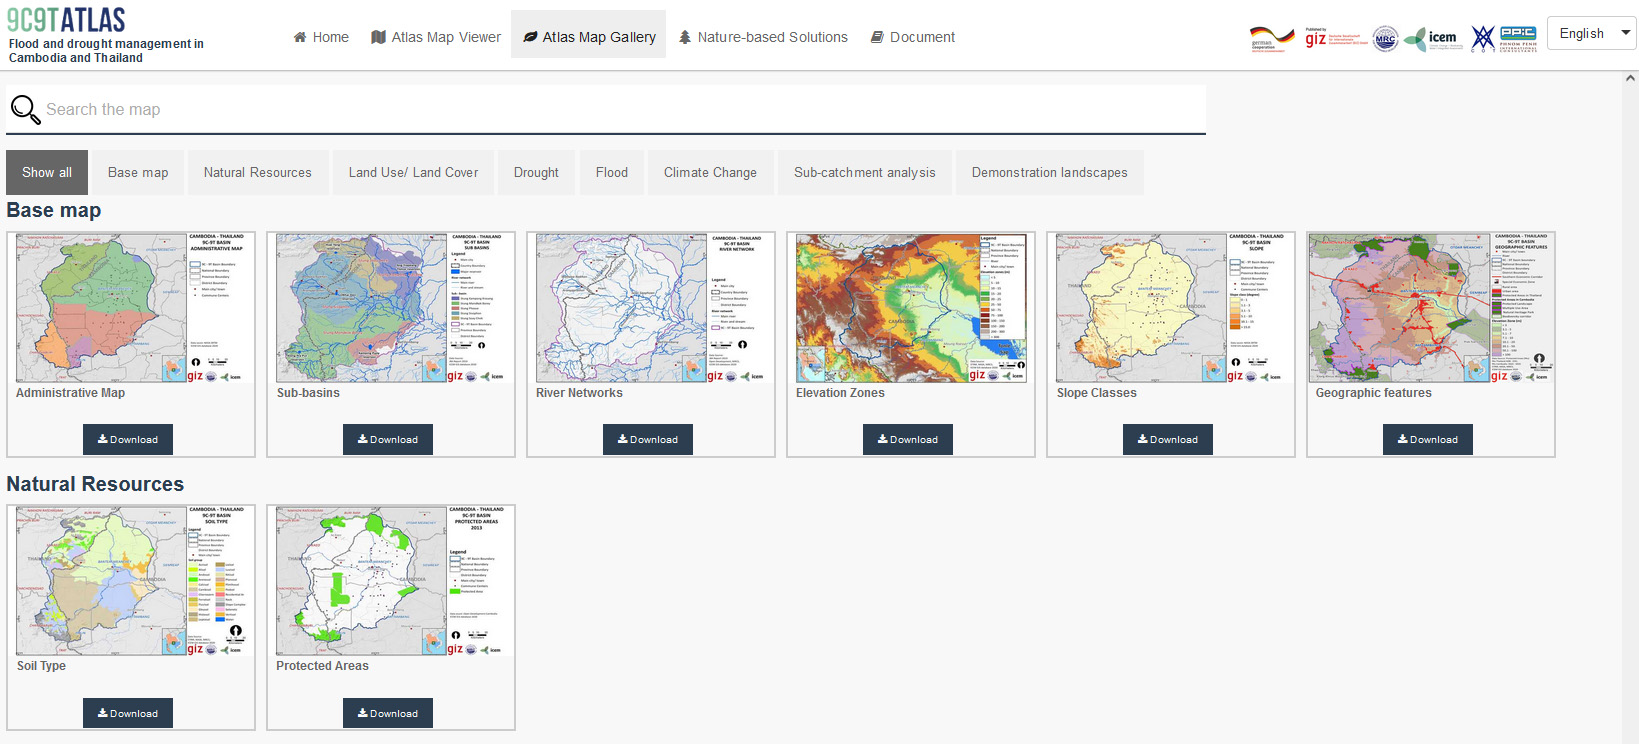
3. Map Gallery
The Map Gallery includes an extensive list of high-quality and innovative maps on core topic areas. Map categories include: base maps, Natural Resources; Land Use ? Land Cover; Drought; Flood: Climate Change; and Demonstration Landscapes.
With each map, users can:
Figure 11: Map gallery
4. Nature-base Solution catalogue
The Nature-based Solutions (NbS) catalogue presents a range of NbS) with potential to build flood and drought resilience in the 9C-9T sub-basin. Concise good practice summary sheets are provided for over 50 measures applicable to the 9C-9T and measures are categorised into upstream hydrology, agriculture and urban landscapes. Information in each sheet presents: the relevant application for each NbS; a brief description of the intervention; its impact on climate resilience; relevant information sources; the NbS benefits; and suitability considerations and limitations of the measure. This information is displayed on in an interactive factsheet that can also be downloaded for future offline use and reference.
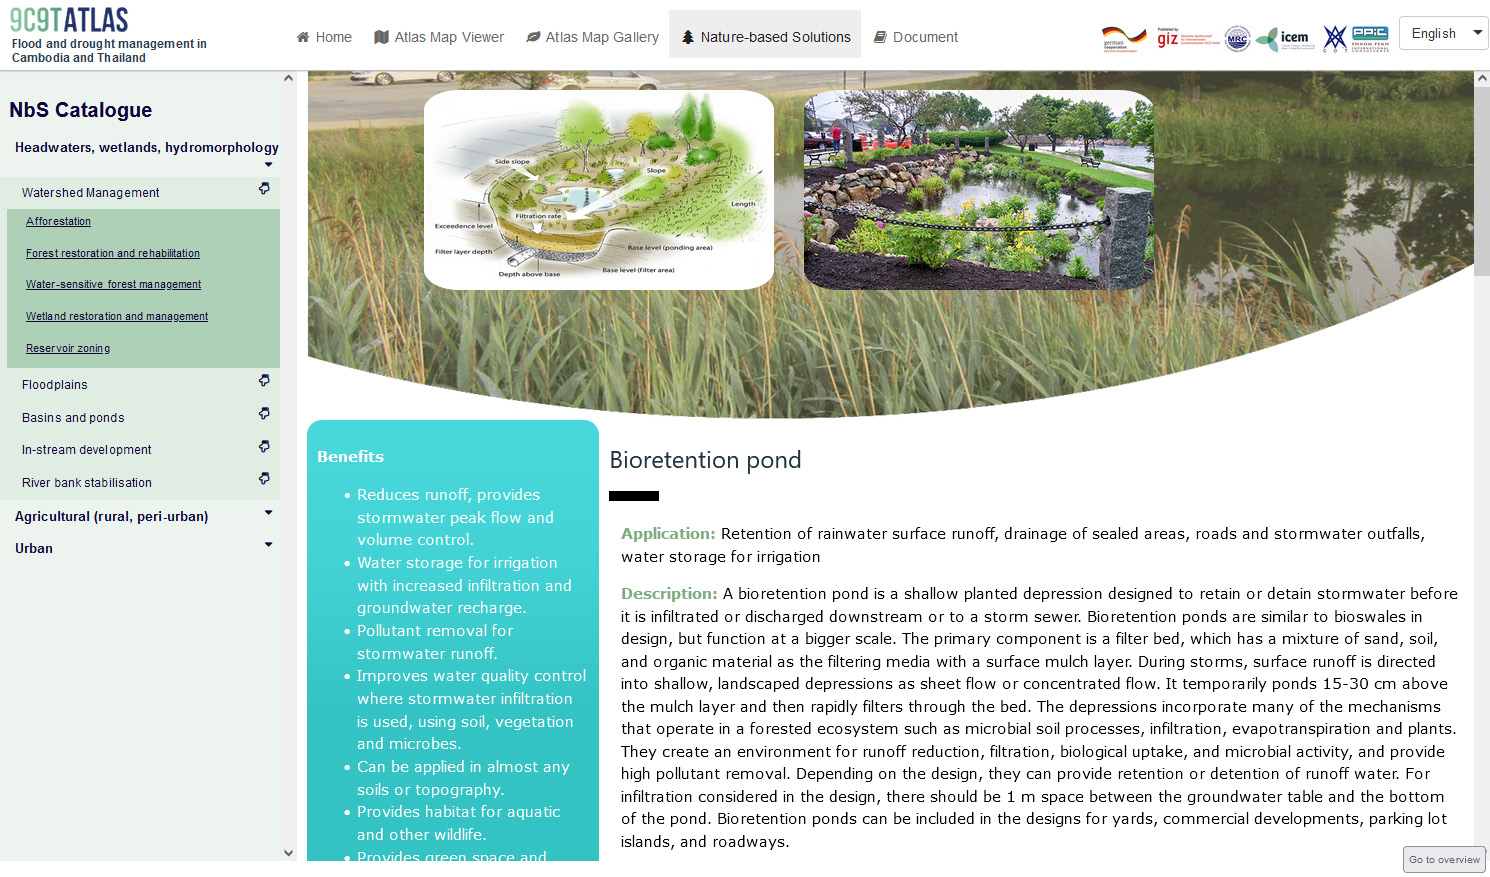
Upon entering the catalogue page, a Measure Effect matrix is presented along with a menu to the right listing all measures. The NbS are grouped by different sectors and purposes (Figure 12). To view an NbS factsheet, users can either click on NbS name on the matrix or on the menu. Information on each NbS is displayed on a factsheet that can also be downloaded as PDF for future reference (Figure 13).
Figure 12: NbS catalogue
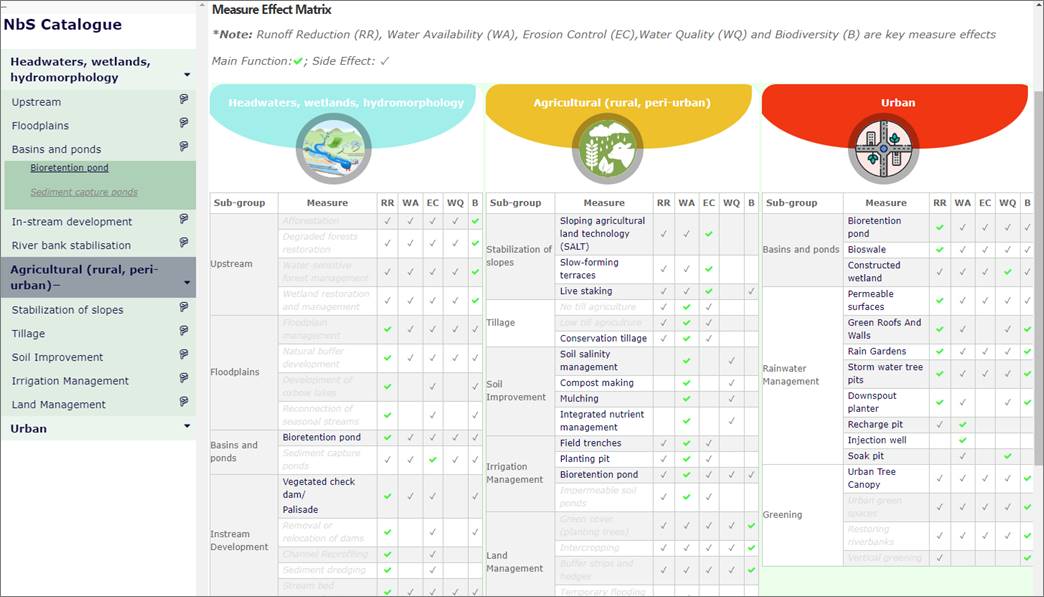
Figure 13: Example of NbS factsheet
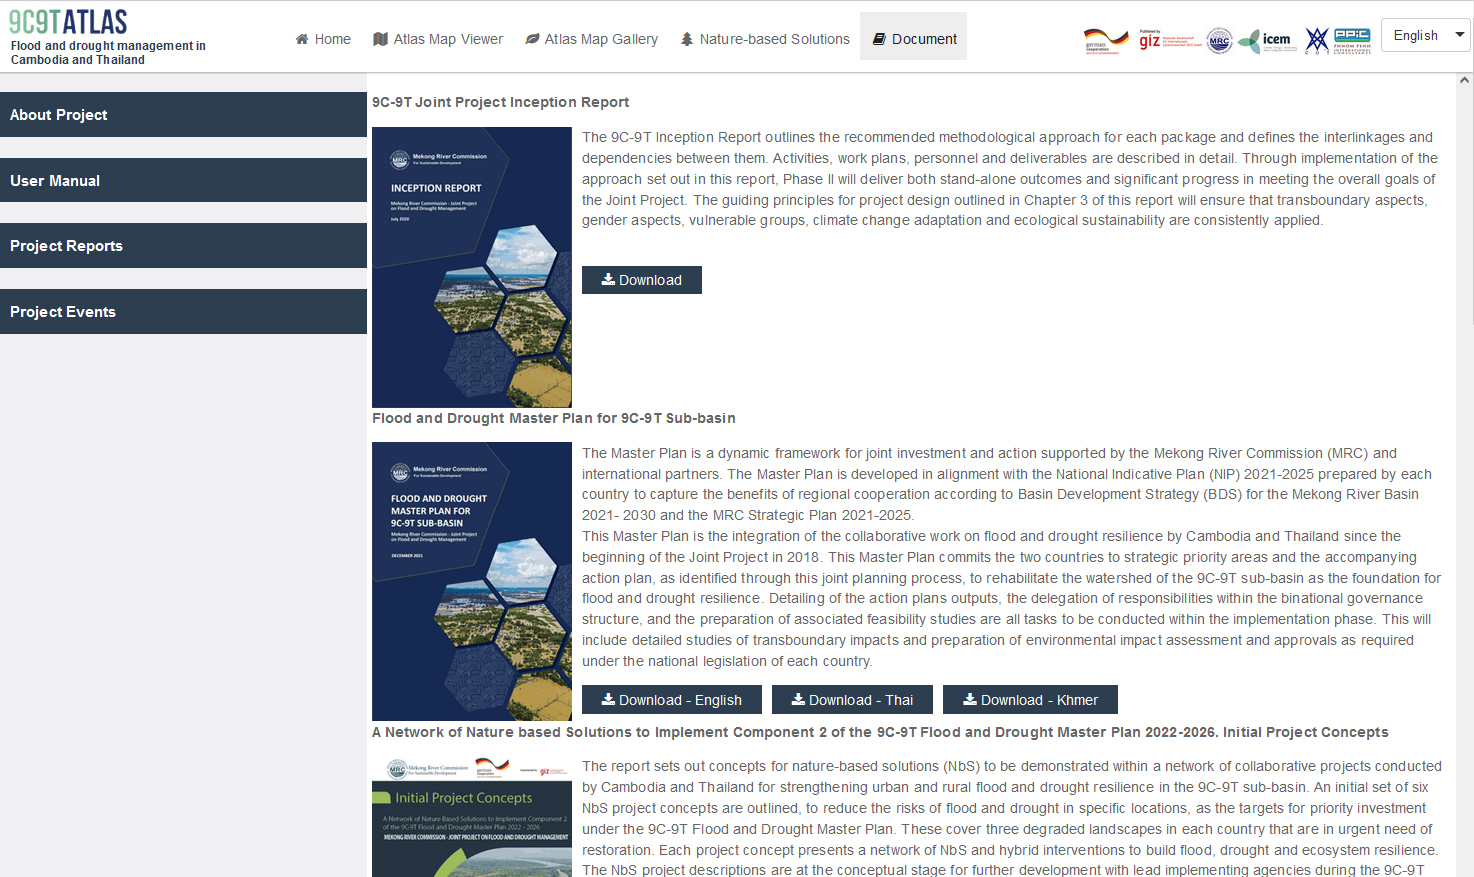
5. Documents
The Atlas document page provides users with a User Manual of the Atlas and a number of key project reports. A list of project events is also included on this page.
Users can download project reports in PDF format by clicking on the ![]() button (Figure 14).
button (Figure 14).
Figure 14: Document page